Who Moved My Logs (Robust Node.js Console)

\Hero image from* Imgur
Which 'Where is Waldo' image is the hardest one? The one where all the figures look like Waldo. With reading logs it is not very different. I have started my first full-stack job six years ago. Debugging Javascript programs is a skill worth learning, with plenty of pitfalls, heavy dependency on third-party code, environment dependent and other challenges. For me, there was one tool that made debugging on Node.js easier and since it got to puberty, I think #DebuggingFeb is a great option to share it.
Any JS developer loves the browser console:
Easy to read, the log level is prominent: log, warning, error
Where is the log coming from pointer to the filename and line number
Interactive
Yes, I know there are many different debug-tools for Node.js other than console.log(), still, this one is the easiest to use and also the only one which will work 100%, in all environments and with zero setup. Having this in mind let's take a look at how to smooth things up to easily find our Waldo log.
The code that I will present here is part of a WIP NPM package but it can already be used as is. The third point on the list above is off the scope for this post, but the other two are for sure going to be enjoyable improvements to the boring node console.
Let's start the trip from plain to informative:
Understanding console.log
We want to change the boring but useful console.log() into something more informative which is easier to search through. The goal is to have each log level printed out in a different color and also to add a timestamp to it and a path pointer that shows where in the code it happened.
First let's take a look at the standard console functions, log, error etc. In the official docs, it says that some of those functions are aliases of others and also the key point is that all of them are process.stdout.write() (or stderr but it is a minor difference in our case) called with util.format() and newline attached: process.stdout.write(util.format(...args) + '\n').

New console method boilerplate
// console.success.ts
const util = require('util')
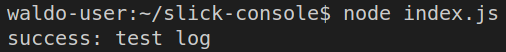
console.success = (...args: any[]): void => {
process.stdout.write('success: ', util.format(...args) + '\n')
}
That's it, once we require this file somewhere we can run the new console message and we will see it success: + test log:
// index.ts
require('./console.success.ts')
console.success('test log')
Adding Colors
We will create a .ts file that will export a single function. I would like to do it this way so that later on we could pass some configs into this function. For now, we will work only on the log function and later on will expand it to other functions as well. The following code is just re-creating the standard console.log and we will not see any change.
// slick-console.ts
const util = require('util')

module.exports = () => {
  console.log = (...args: any[]) => {
    process.stdout.write(util.format(...args) + '\n')
  }
}
The console has its own color pallet (well, calling it pallet is a bit too much credit), and it can be set by writing specific strings to the console. Below is the basic list, though more colors can be used as well, check this gist for more info.
black = '\x1b[30m'
red ='\x1b[31m'
green = '\x1b[32m'
yellow = '\x1b[33m'
blue = '\x1b[34m'
magenta = '\x1b[35m'
cyan = '\x1b[36m'
white = '\x1b[37m'
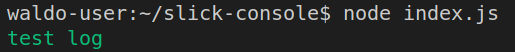
Let's make our message green.
// slick-console.ts
...
  console.log = (...args: any[]) => {
    process.stdout.write('\x1b[32m')
    process.stdout.write(util.format(...args) + '\n')
  }
...
But if you try now console.info after that, the color is still green, not exactly desirable. Luckily we also have a reset code '\x1b[0m', let's use that too:
// slick-console.ts
...
  console.log = (...args: any[]) => {
    process.stdout.write('\x1b[32m')
    process.stdout.write(util.format(...args) + '\n')
    process.stdout.write('\x1b[0m')
  }
...
Now we have a unique log color but we do not pollute the console for other messages. We can use the same code to add different colors to the other log levels.
Adding Timestamp and File Path
The timestamp is a rather easy one, new Date().toLocaleString() will do the job. We can combine it with blue color to have it more readable:
// slick-console.ts
...
module.exports = () => {
  const printTime = (): void => {
    process.stdout.write('\x1b[34m')
    process.stdout.write(new Date().toLocaleString())
    process.stdout.write('\x1b[0m')
  }

  console.log = (...args: any[]) => {
    printTime()
    process.stdout.write('\x1b[0m')
    process.stdout.write(util.format(...args) + '\n')
    process.stdout.write('\x1b[0m')
  }
}
For now, I've reset the console.log color to its original.
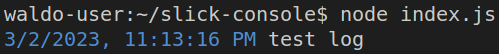
Now our console.log() statement will be prefixed with a timestamp. Imagine an error occurred on your server, finding when can be key to understand why. With this simple function, we just got a step closer to finding our Waldo.
Now for the most tricky part of this post, prefixing the log with a file path + line pointer + column pointer. In Javascript if we want to generate a call stack of the current line the only way to do so, is by creating an error, yup, that's right. But not one that will crash the code, only creating, not throwing.
// Creating error
const error = new Error()
// Now we can do something with it or ignore it, the program will continue

// Throwing error or something else
throw new Error()
// The program will crash
But just creating an error is not enough, we need to prepare the stack trace and capture it, you can read more about prepareStackTrace, an internal V8 method or TLDR - the following snippet:
import { CallSite } from "callsite"

const errStack = () => {
  const origPrepareStackTrace = Error.prepareStackTrace
  Error.prepareStackTrace = (err, stack) => stack
  const err = new Error()
  Error.captureStackTrace(err, errStack)
  const { stack } = err
  Error.prepareStackTrace = origPrepareStackTrace
  return stack as unknown as CallSite[]
}
Now we have the call stack, which means all the functions that were called preceding the current one. From this stack, we can get the file where the console.log() was written, its line number and column number.
import { CallSite } from "callsite"
const path = require('path')

const getPosition = (myStack: CallSite[]) => {
    const fileFromStack = myStack[2] // Will explain below
    const absoluteProgramPath = process.cwd()
    const absoluteFilePath = fileFromStack.getFileName()
    const relativeFilePath = path.relative(absoluteProgramPath, absoluteFilePath)
    const lineNumber = fileFromStack.getLineNumber()
    const columnNumber = fileFromStack.getColumnNumber()
    return `${relativeFilePath}:${lineNumber}:${columnNumber}`
  }
myStack is an array of CallSite, which is how Node knows who called the current function and how the call-stack-trace is being preserved. The index we use on myStack[2] is important because with the wrong index, we will find the wrong file. Looking at the code snippet below will be easier to understand it. If we will select call-stack index [0] we will get the errStack function, since this is the one where the error was created. Going up to [1] will give us the printPosition function since this is the function that calls errStack. This is how we get to [2] which is the console.log call.
That is why 2 is the default relativeDepth param, since we want to find the place where console.log() was called. But, if for example, we use console.log() in a logger function and now we want to know where was the logger function called we can increase the index accordingly.
// slick-console.ts
import { CallSite } from "callsite"
const path = require('path')
...
module.exports = () => {
  const getPosition = (myStack: CallSite[]) => {
    const fileFromStack = myStack[2]
    const absoluteProgramPath = process.cwd()
    const absoluteFilePath = fileFromStack.getFileName()
    const relativeFilePath = path.relative(absoluteProgramPath, absoluteFilePath)
    const lineNumber = fileFromStack.getLineNumber()
    const columnNumber = fileFromStack.getColumnNumber()
    return `${relativeFilePath}:${lineNumber}:${columnNumber}`
  }

  const errStack = () => {
    const origPrepareStackTrace = Error.prepareStackTrace
    Error.prepareStackTrace = (err, stack) => stack
    const err = new Error()
    Error.captureStackTrace(err, errStack)
    const { stack } = err
    Error.prepareStackTrace = origPrepareStackTrace
    return stack as unknown as CallSite[]
  }

  const printPosition = (): void => {
    process.stdout.write('\x1b[35m')
    process.write(getPosition(errStack())
    process.stdout.write('\x1b[0m')
  }

  console.log = (...args: any[]) => {
    ...
    printPosition()
    process.stdout.write('\x1b[0m')
    process.stdout.write(util.format(...args) + '\n')
    process.stdout.write('\x1b[0m')
  }
}
Stitching it all Together
Here we will combine the info functions from above, the printPosition, printTime, and the colorful console.log replacer into one piece.
// slick-console.ts
import type { CallSite } from "callsite"

const path = require('path')
const util = require('util')

declare global {
    interface Console {
        success: (...args: any[]) => void;
    }
}

module.exports = (): void => {
  const printTime = (): void => {
    process.stdout.write('\x1b[34m')
    process.stdout.write(`${new Date().toLocaleString()} `)
    process.stdout.write('\x1b[0m')
  }

  const getPosition = (myStack: CallSite[]) => {
    const fileFromStack = myStack[2]
    const absoluteProgramPath = process.cwd()
    const absoluteFilePath = fileFromStack.getFileName()
    const relativeFilePath = path.relative(absoluteProgramPath, absoluteFilePath)
    const lineNumber = fileFromStack.getLineNumber()
    const columnNumber = fileFromStack.getColumnNumber()
    return `${relativeFilePath}:${lineNumber}:${columnNumber}`
  }

  const errStack = () => {
    const origPrepareStackTrace = Error.prepareStackTrace
    Error.prepareStackTrace = (err, stack) => stack
    const err = new Error()
    Error.captureStackTrace(err, errStack)
    const { stack } = err
    Error.prepareStackTrace = origPrepareStackTrace
    return stack as unknown as CallSite[]
  }

  const printPosition = (): void => {
    process.stdout.write('\x1b[35m')
    process.stdout.write(`${getPosition(errStack())} `)
    process.stdout.write('\x1b[0m')
  }

  console.log = (...args: any[]) => {
    printTime()
    printPosition()
    process.stdout.write('\x1b[0m')
    process.stdout.write(util.format(...args) + '\n')
    process.stdout.write('\x1b[0m')
  }

  console.success = (...args: any[]) => {
    printTime()
    printPosition()
    process.stdout.write('\x1b[32m')
    process.stdout.write(util.format(...args) + '\n')
    process.stdout.write('\x1b[0m')
  }
}
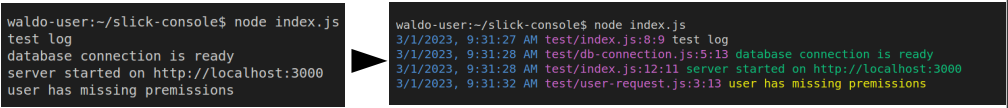
There you go, after requiring this file and calling its default function you are set to go. Every console.log('test log') will look like this:

Now finding Waldo will be a piece of cake.

*image from imgur
Why Another Package
Good code practices always encourage us to set up a logging system, like winston or pino, right from the start. I know even Eslint is annoyed (only warnings though) by console statements. But, when we start to work on something in our backyard some good practices are not directly planted. There for very often, when you open a JS project you will find console statements in all kinds of shady places like try-catch blocks, callbacks and promise-rejections. Exactly for this reason I like this module: install => require => debug! Zero refactoring and directly much more informative logging, than the default console.
If you want to use it check it out on GitHub, download it with npm or fork it and create the debugging console that suits your needs.
Thanks for reading and happy debugging.